
In today’s world, many companies struggle with data analysis. Data is a key element in making business decisions (or at least it should be). To effectively present this data, we must first model it appropriately. In today’s post, we will try to “promote” a solution that makes our team’s daily work with data easier. I invite you to read the article and share your thoughts in the comments.
Data acquisition
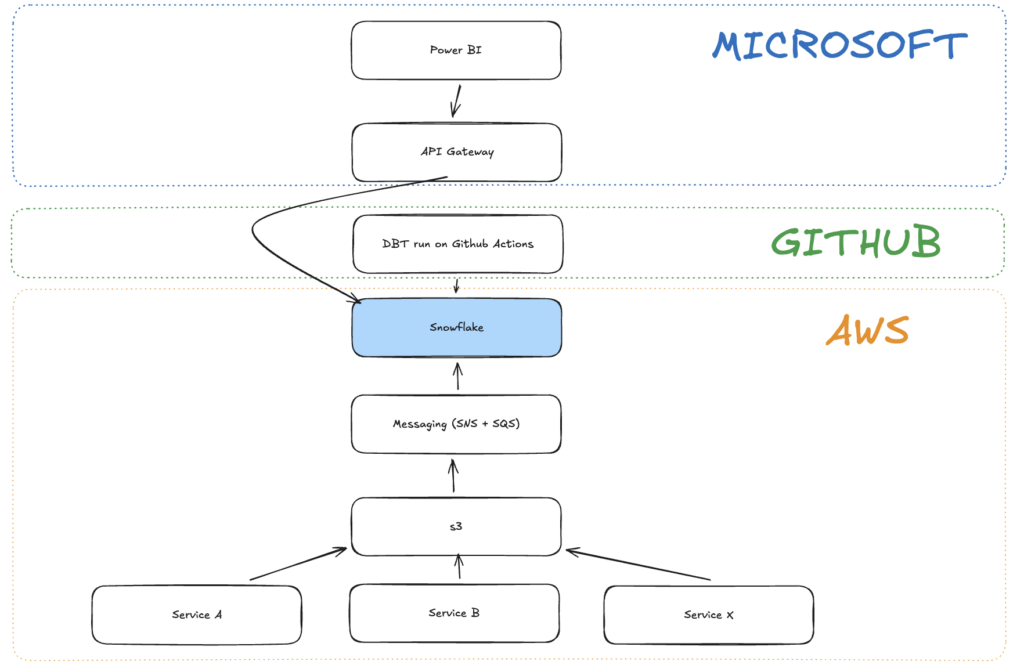
For the purpose of this blog post, we will assume that data can flow into S3 (AWS’s data storage service) from many different sources in many different formats. Let’s look at the graphic below to get a general understanding of how this works from a data acquisition perspective.
Communication between S3 and Snowflake
This is a crucial part of the entire ecosystem. This element automates and relieves you of the responsibility for the smooth flow of data from S3 to Snowflake. Let’s delve a little deeper into this element and the best way to configure it. Since Snowflake runs on AWS infrastructure, configuration and communication between the services is simplified. Snowflake supports this in a very clever way. Below, I will show a flow diagram that illustrates this nicely. This will explain the magic behind this setup, which I personally really like and use in both personal and commercial projects.
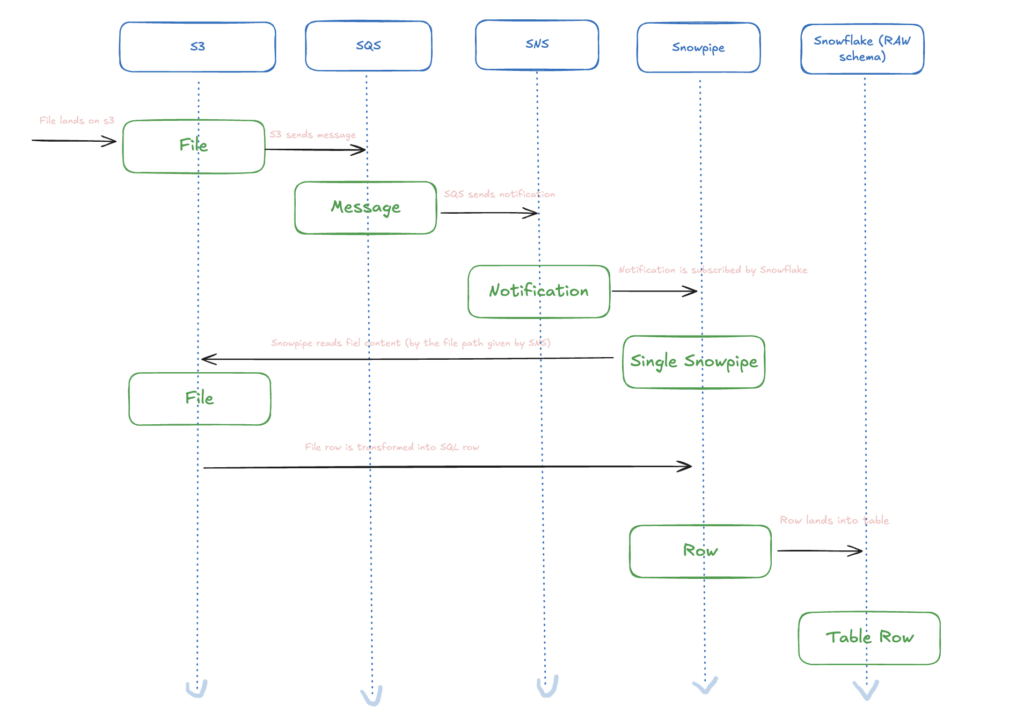
A brief comment on the diagram above: We start from the moment the file is physically placed in our file system. In S3, we have the option of sending messages to an SQS queue when a specific event occurs: file added, file deleted, file modified, etc. This allows us to create the foundations of a reactive system.
The next step is to transpose the messages in the SQS queue into notifications in SNS. Amazon SNS (Simple Notification Service) is an AWS cloud service that allows applications to send notifications to multiple recipients simultaneously. It works by publishing messages to “topics” and then delivering them to multiple subscribers. SNS can send notifications through various channels, such as: Lambda functions, SMS messages, emails, push notifications to mobile applications, HTTP/HTTPS requests, and SQS queues.
Snowpipe as the golden solution
Thanks to Snowpipes, we can define what we listen for and what we do with that information. I don’t like talking without an example, so let’s look at the code right away:
CREATE OR REPLACE PIPE pipe_data_source_data_provider_domain_table
AUTO_INGEST = TRUE
AWS_SNS_TOPIC = ‘arn:aws:sns:us-east-1:2472837483:name_of_the_sns_service’
AS
COPY INTO data_source_data_provider_domain_table (
data,
filename,
file_row_number,
file_last_modified
)
FROM (
SELECT
$1,
METADATA$FILENAME,
METADATA$FILE_ROW_NUMBER,
METADATA$FILE_LAST_MODIFIED
FROM @your_bucket/provider/prod/
)
FILE_FORMAT = (type = ‘PARQUET’)
PATTERN = ‘*_domain_.*/.*table/.*’;
The code is quite simple. It’s a definition of a PIPE, which has several key elements.
- Name – the name of the Snowpipe, which should define, by convention, where the data is coming from and where it is going.
- SNS Topic – the address of the topic we are listening to – important: we must have the necessary permissions granted to the Snowflake instance – this is done in the role configuration in SNS. I won’t show this in this post as it’s a standard procedure and many examples can be found online; the Snowflake documentation also describes it well.
- The COPY statement is part of the definition that specifies what we are copying, in what format, and from where; it also has its own sub-elements:
- INTO – which table the data is inserted into
- FROM – which path should we listen to (SNS message filtering) – try to narrow down the FROM path as much as possible to save on S3 scanning costs with Snowpipe.
- FILE FORMAT – what type of files are we looking for during the monitoring process?
- PATTERN – the file path pattern we expect.
All these elements form a living entity, whose existence we can verify and whose history we can also examine through queries:
DESCRIBE PIPE XXX;
and
SELECT * FROM TABLE(INFORMATION_SCHEMA.PIPE_USAGE_HISTORY( PIPE_NAME => 'MY_PIPE' ));There are many ways to monitor the operation and status of Snowpipes, but we will dedicate a separate post to that. I think the concept is clear, and we can move on.
Raw in the table!
The result of the above actions is the creation of rows in the target table, which we call RAW.name_of_the_table. This will be the lowest layer in our Snowflake instance. It will serve as the foundation from which our tables at the DBT level (or other data analysis tool) will read data.
When a row is inserted into the RAW table, we can trigger GitHub Actions, either according to a schedule or via a trigger, which then performs the transformation step in our ELT process. The diagram below illustrates how to model the data at a high level:
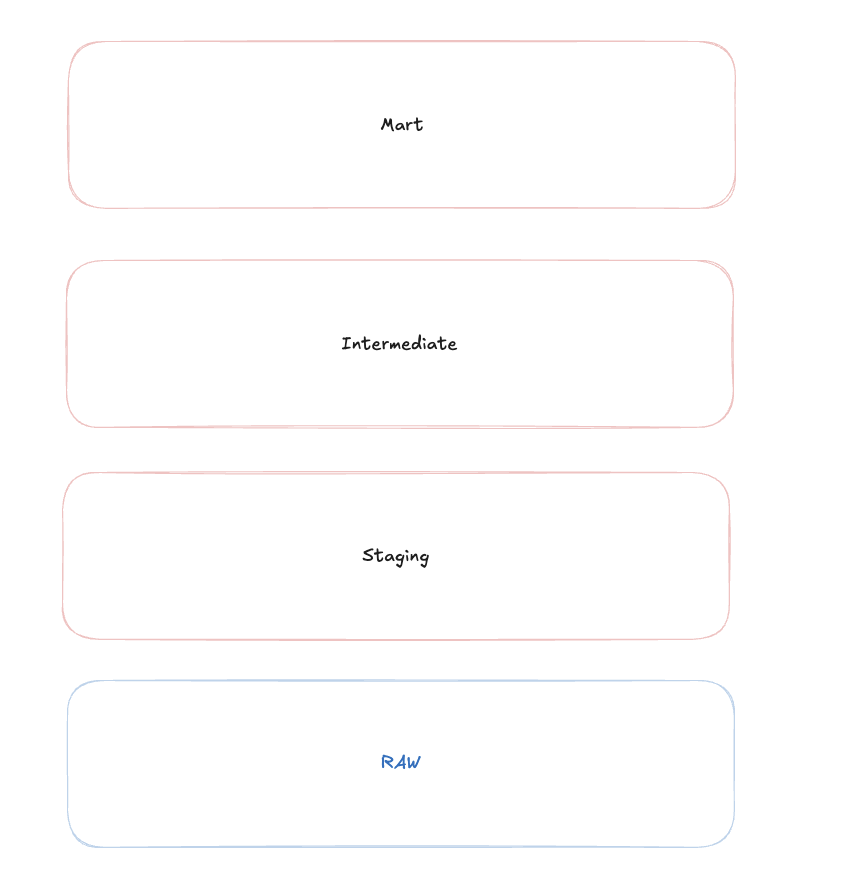
A quick explanation: We don’t necessarily have to use the methodology I presented: stg->int->mart. It’s a matter of convention, and there are many solutions, such as medallion or bronze->silver->gold. You can choose from many options. We won’t go into that level of detail today, but we’ve shown a simple example of how this data can be modeled.
The data is modeled
Once the data is ready to be read, we can easily proceed to reading it at a higher level. In our solution, we use Power BI, but you can use other tools for reporting, such as: Tableau, Looker, Qlik Sense, Metabase, Apache Superset, Sisense, Domo. There are many such tools on the market today. It all depends on the needs and capabilities of your organization.
For better security, access should be tunneled. Ideally, this should be configured in such a way that there is an intermediary between the Power BI instance and Snowflake that controls data traffic between the platforms. This is important and can be solved in many ways. To implement IP whitelisting, for example, you can configure an API Gateway that will act as our guardian.
Of course, this slightly complicates the process of creating reports, because the team needs to be prepared for this, and their local computers must be configured to connect via VPN, and access must be managed through login/password (which expire) or SSO. This always creates maintenance challenges, but in return we have a very secure and airtight system. I will describe more details in another article. Today, we are discussing this topic at a very high level, and I don’t want to write a whole book on security here. Besides, it’s not entirely my area of expertise, so I need to educate myself further.
Finally, the reports
At the end of this path, we always have a layer that presents the data. This is the most enjoyable part for the business, because from their perspective, our system is Power BI. They don’t need to, and SHOULDN’T, be aware of the technical details. It’s our problem and responsibility as a technical team to hide these implementation details from them.
For businesses, we can create systems of reports, analyses, and applications that will help them with their daily operational activities and decision-making. Our goal is not to create a technical monstrosity, but to provide value to the business. If the stakeholders are using our solutions, we should be satisfied. If not, then we have a long road ahead of us to solve this problem. I’ll write more about this sometime, because it’s a vast topic.
Summary
If you’ve made it to the end, that’s great! That’s all for today. I hope the above diagram has clarified the goal and the means we intend to use. It should also explain the specific problems we are solving and why this solution is very attractive and doesn’t require significant investment. In this project, three of us created a data platform consisting of over 600 tables and over 50 reports. It’s amazing that we only needed a few months to do this. There was a tremendous amount of work, but the satisfaction from the completed job was immense. I encourage you to familiarize yourself with the details and look forward to further articles related to the individual elements of the above solution. This article is just an introduction. Stay tuned for more!