Today we’ll talk about metrics in software development. I’ll start by showing a cool graphic I found on the LeaderShip Failed Successfully podcast channel. This graphic will serve as the basis for discussing each metric and assessing who needs them and why.
Let me start with the video that prompted me to discuss this topic:
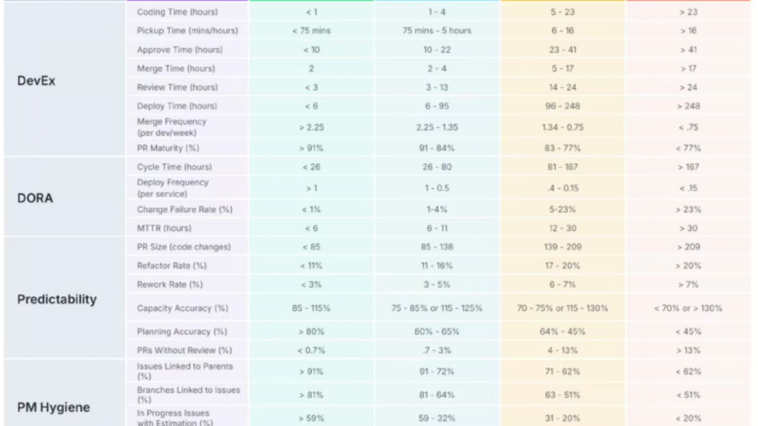
I was particularly interested in the report the guys showed in the video:
Metric groups
We see four groups of the most popular metrics. Before delving deeper into the topic, I’d heard a lot about DORA. I was also asked about it during a recent job interview. Let’s start with DORA.
DORA – DevOps Research and Assessment
It consists of 4 metrics (according to the video’s authors, a 5th metric has been added – I’ve verified this and will include it in the description below). The metrics are intended to measure the speed of delivery and the security of the change.
Deployment Frequency (DF)
How often does the team implement changes into production?
→ measures the team’s ability to quickly deliver value.
Lead Time for Changes – Cycle Time (LT)
Time from commit/merge to launching a change in production
→ measures the efficiency of the delivery process
Change Failure Rate (CFR)
Percentage of deployments causing incidents, rollbacks, or hotfixes
→ measures the quality and stability of changes
Mean Time to Recovery (MTTR)
Mean Time to Restore
→ measures the resilience of the system and team
Reliability
measures how well the system actually meets user expectations in terms of:
- SLO/SLA compliance.
- availability,
- stability,
- operational correctness
Let’s look at the table
If we look at the graphic, we’ll notice that the best (elite) teams are able to deploy code (Deployment Frequency )on average every day. This means that at least one version of the code (new feature, functionality) is released into production every day. The same applies to the Lead Time for Changes (Cycle Time). From the moment a change is committed, it should take approximately one day for that change to be deployed to production.
Change Failure Rate – this is a very important metric and according to the report, the number of problematic implementations should be lower than 1% – what’s more, there are teams that deliver such results.
Another metric from the report is MTTR – the ability to respond to bugs/incidents in production. Recovery time is crucial – we don’t want our customers/users to be stuck with a broken application. The best teams can resolve these issues in less than 6 hours.
Dora – good for starters but too general for programmers
My conclusion for delving into the topic is simple – DORA helps the entire team, but especially the DevOps team, maintain the smoothness and stability of the system at a good level.
Another group of metrics, DevEx, comes to the rescue:
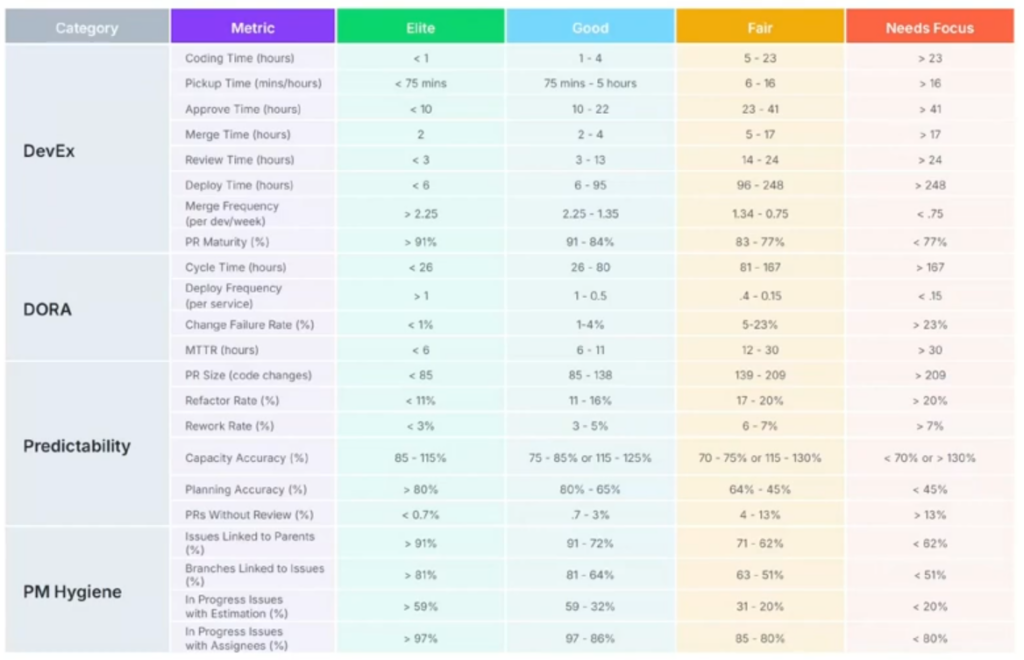
We have several elements here:
- Coding Time (hours) – Coding time is what we like best – top teams need on average less than an hour to code a solution.
- Pickup Time (hours/minutes) – Pickup time – The time it takes a programmer to start a task and change its status to in-progress. The best teams need less than 75 minutes to do this.
- Approve Time (hours) – the amount of time needed to receive approval for deployment to production; <10 hours is already an excellent result according to the table above.
- Merge Time (hours) – the number of hours between completing a CR and merging changes to the main branch. Elite teams can do this in 2 hours (on average).
- Review Time (hours) – how long a code review takes. The best teams can do it in less than 3 hours.
- Deploy Time (hours) – how many hours it takes to deploy after merging to the main branch. Elite teams can do it in less than 6 hours. This reflects Lead Time for Changes from DORA.
- Merge Frequency (per dev/week) – how many PRs per developer are merged per week. The best teams can maintain this metric at >2.25 PRs per week.
- PR Maturity – a very important metric that indicates the percentage of PRs that are immediately useful for Implementations without post-code review fixes. Top teams maintain this at >91%
Other metrics. Do we need them?
I will answer this question briefly: NO. In my opinion, DORA + DevEX is more than enough to observe and draw conclusions. However, if you’re interested in learning about Predictability and PM Hygiene, I encourage you to watch the video or at least take a look at the graphic I’ve shared above.
Summary
In conclusion, I’d like to remind you that metrics aren’t meant to put pressure on us as developers or DevOps teams, but rather to help us continuously improve our performance and identify bottlenecks in the software development process. If you want to implement metrics gradually, I suggest starting with DORA, then adding (perhaps not even all) the DevEx elements. This should be enough to test the metrics in your environment and select the ones you can influence.
I hope this article has been encouraging. After all, it’s all about becoming better professionals. And what if you want to be better at something you don’t measure? Metrics are just measurable tools for continuous process improvement, and I’d like to leave you with that thought today. I’d appreciate any comments and sharing experiences. Thanks!